
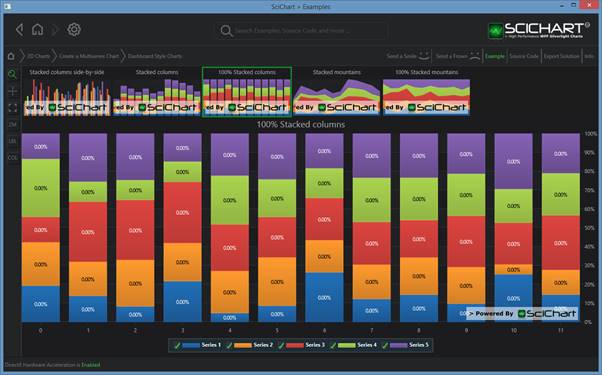
100% Stacked Column Series are provided by the StackedColumnRenderableSeries type. To enable 100% Stacked mode, simply set the StackedColumnRenderableSeries.IsOneHundredPercent property to true.
Examples for the 100% Stacked Columns Chart can be found in the SciChart WPF Examples Suite which can be downloaded from the SciChart Website or our SciChart.WPF.Examples Github Repository.
How the Stacking and Grouping Works
Please see the section under Stacked Column series > “How the Stacking and Grouping Works” for a detailed explanation
Declaring a StackedColumnRenderableSeries in XAML / Code Behind
Please see the section under Stacked Column series > “Declaring a StackedColumnRenderableSeries in XAML / Code” for a walkthrough.
To enable 100% stacked mode, simply set StackedColumnRenderableSeries.IsOneHundredPercent = true
Declaring a StackedColumnRenderableSeries in Pure Code
Please see the section under Stacked Column series > “Declaring a StackedColumnRenderableSeries in XAML / Code” for a walkthrough
To enable 100% stacked mode, simply set StackedColumnRenderableSeries.IsOneHundredPercent = true
Limitations of Stacked Series
When using any Stacked Series type, there are a few important limitations to keep in mind to ensure correct rendering and behavior:
- Consistent X-Values Across Series
All series within a stacking group must share the same X-values – meaning the collections must be of equal length and contain identical values in the same order. This requirement ensures that columns are stacked properly and aligned accurately on the X-axis - X-Values Must Be Valid Numeric Values
The X-values used in stacked column charts must be valid, finite numeric values. Special values such asDouble.NaN,Double.PositiveInfinity, orDouble.NegativeInfinityare not supported and will lead to undefined behavior or rendering issues - Representing Gaps in Series
If you need to represent missing data or create gaps in individual series (e.g., when one series has fewer data points than the others), assignDouble.NaNorFloat.NaNto the corresponding Y-values instead. This tells SciChart to omit rendering the column at that position while preserving the required structure of matching X-values across the group